2016, the quantified life
— 15 min read
Most people think they know how they spend their time. They think they know how much of their lives they devote to certain things and what is important to them. But as many behavioral scientists will tell you, people are not a good judge of themselves.
When you ask someone how often they work out, they'll likely give you an answer that's higher than reality. Some of that can be social pressure to make yourself look better, but even without that desire to impress, most people will overestimate this fact. It works the other way too, as we often underestimate how often we do those things we shouldn't do as much. Guess how many treats you had this year; I bet you'll guess low.
It's not all about diet, but this is why dietitians make their patients keep food journals. It's the only way to get a clear look at your diet because your memory is woefully selective in what it remembers.
At the end of 2015 I decided to take this idea and run with it throughout 2016. I would keep an absurd number of statistics about myself and compile that data throughout the year to assess if I was doing certain things well, average, or just plain terribly. I didn't set goals so I couldn't fail, but I needed to know what I was doing and whether I was behaving the way I wanted.
With all that irrational human reasoning behind us, let's look at the cold hard stats.
Health
I could be doing a whole lot more in this field, as I know that there are tons of ways to track everything from what you eat to where you go. I never do a good job of tracking food, so I focused on my stats, more than the stats of what I was taking in. I focused on weight (a classic), exercise, coffee/alcohol intake, and sleep.
Some areas such as weight, had specific goals, but a lot of this was just to satiate my curiosity. I know I drink coffee almost every day, but how close to every day do I get? I know I could afford to sleep more, but how much sleep do I really get? That's what I set out to find out and the numbers are fascinating (at least to me).
Weight
Hardware: Withings Body Scale
Software: Withings Health Mate (iOS/Android)
Weight is not something I'm hugely concerned about. I feel like I'm in a pretty decent spot, but I do like to keep track of it to make sure I'm not trending in a bad direction.
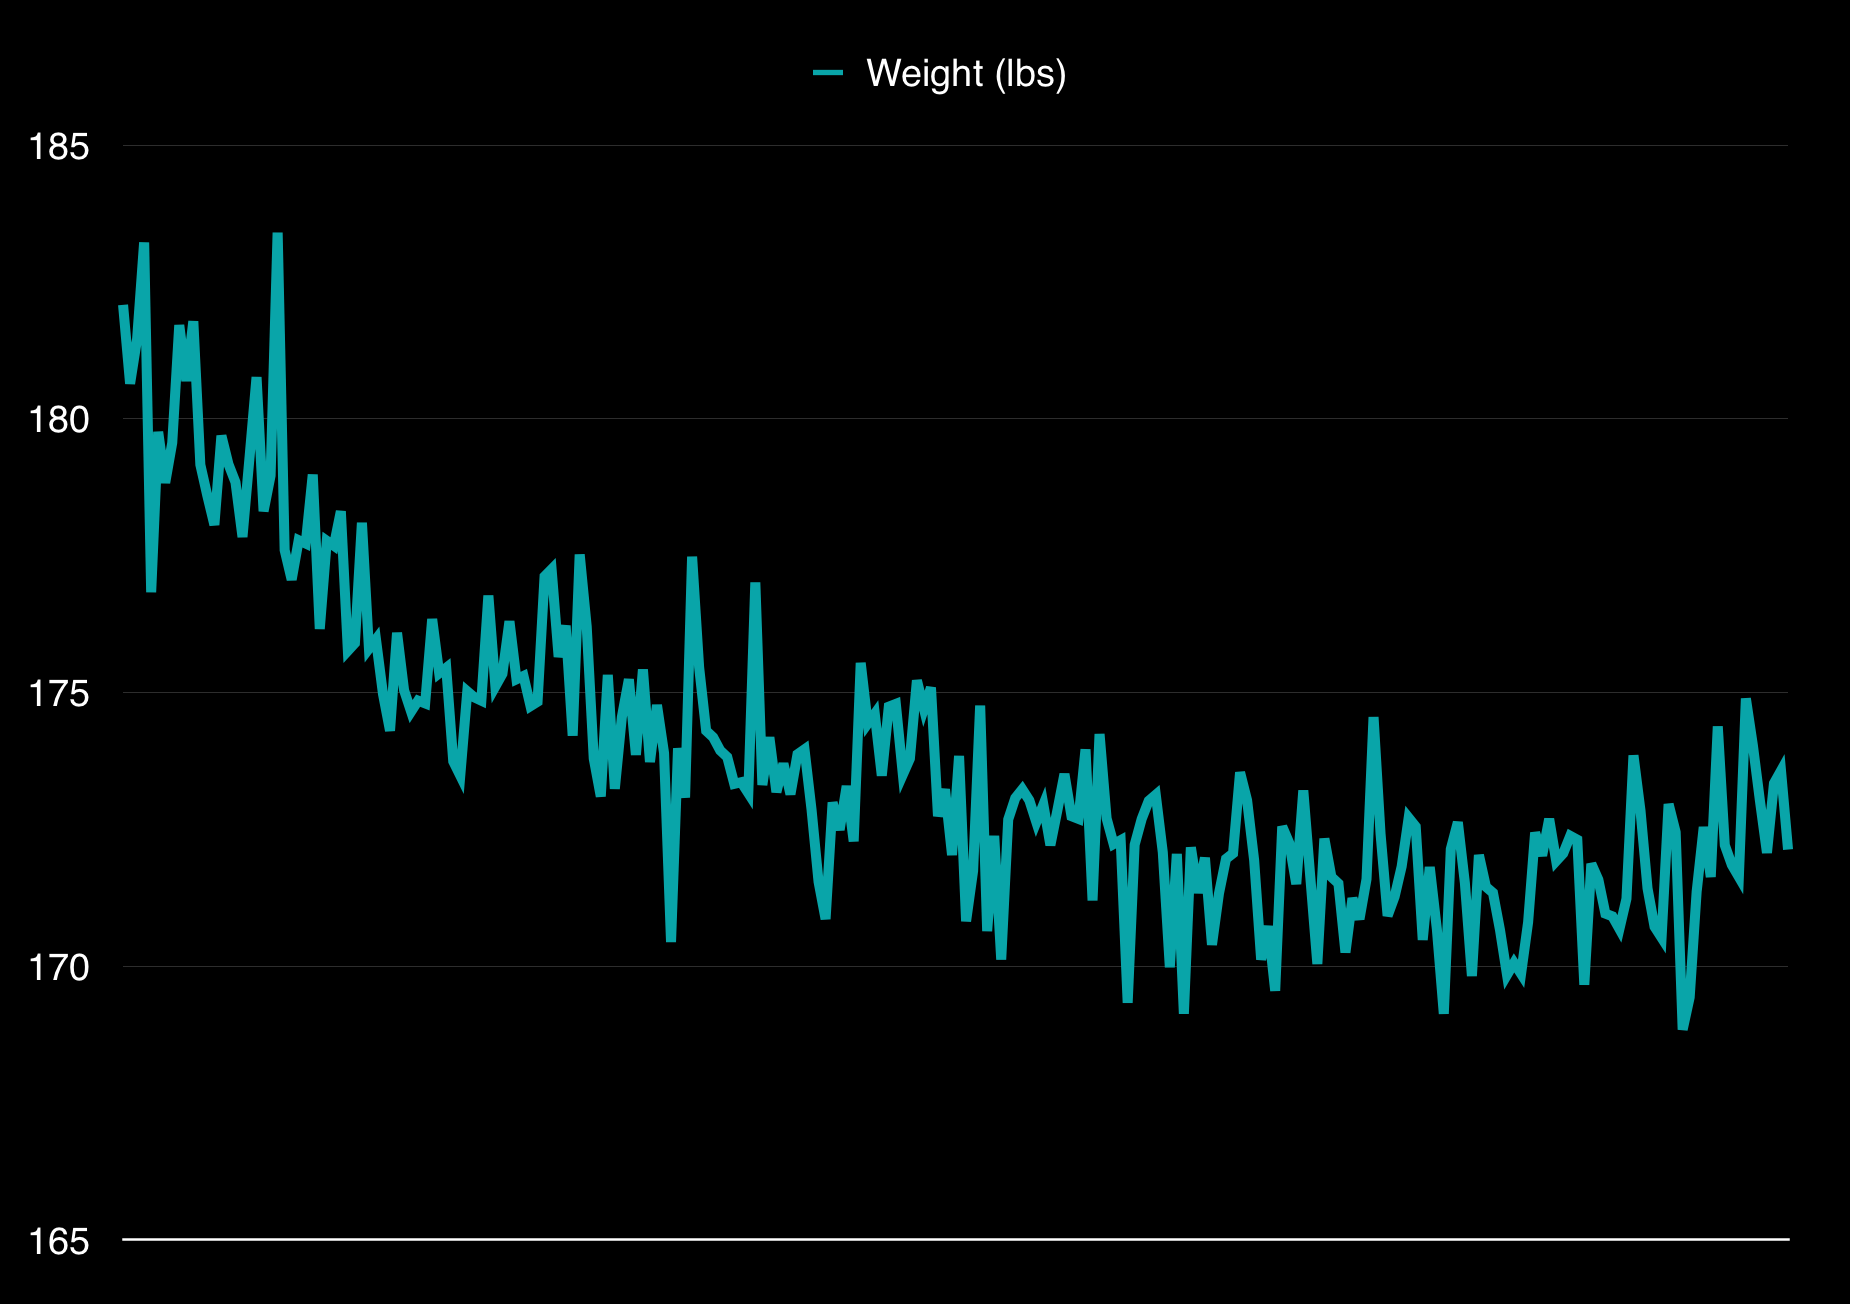
My goal in 2017 was to drop consistently below 180 lbs and if possible get under 170 before Thanksgiving. The idea was that I could then eat whatever I wanted from then until New Year's. There's too many goodies around that time of year and I loved the idea of not having to deprive myself of that just to "watch my figure."
As you can see in the chart, my last day weighing in over 180 was on January 27 and I've been below that mark ever since. By June I was reliably under 175 and started to hover right around 170. Overall, I'm 9 lbs lighter today than I was a year ago, and that's fantastic.
- Highest weight: 183.22 lbs (Jan 5)
- Lowest weight: 168.84 lbs (Nov 18)
- 30 day rolling average Dec 31 2015: 182.2 lbs
- 30 day rolling average Dec 28 2016: 172.9 lbs
- Change in December 2015 vs 2016: -9.3 lbs
Exercise
I've been a runner for years, and it's far and away my favorite way to exercise. In 2016 I took up weight lifting as well, as I was worried my desk job was making me go weak. It's every nerd's dream to have guns right?
Well I don't have "guns" but I'm definitely in better shape than I've been in years. I just turned 31 this year, and it's great to be able to say I'm healthier today than I ever was in my 20s.
Running
Hardware: Apple Watch Series 1
Software: Workouts (Apple), Runkeeper (iOS/Android), Nike+ Run CLub (iOS/Android)
My favorite way to stay in shape is running. I don't do treadmills or gyms, I just run outside. No matter whether it's 0°F and I want to die, or it's 100°F and I…also want to die, I like to get out there and run. It's when I get in a lot of my podcast and audiobook time, which is a great motivator to get out there. Here's how I ran in 2016:
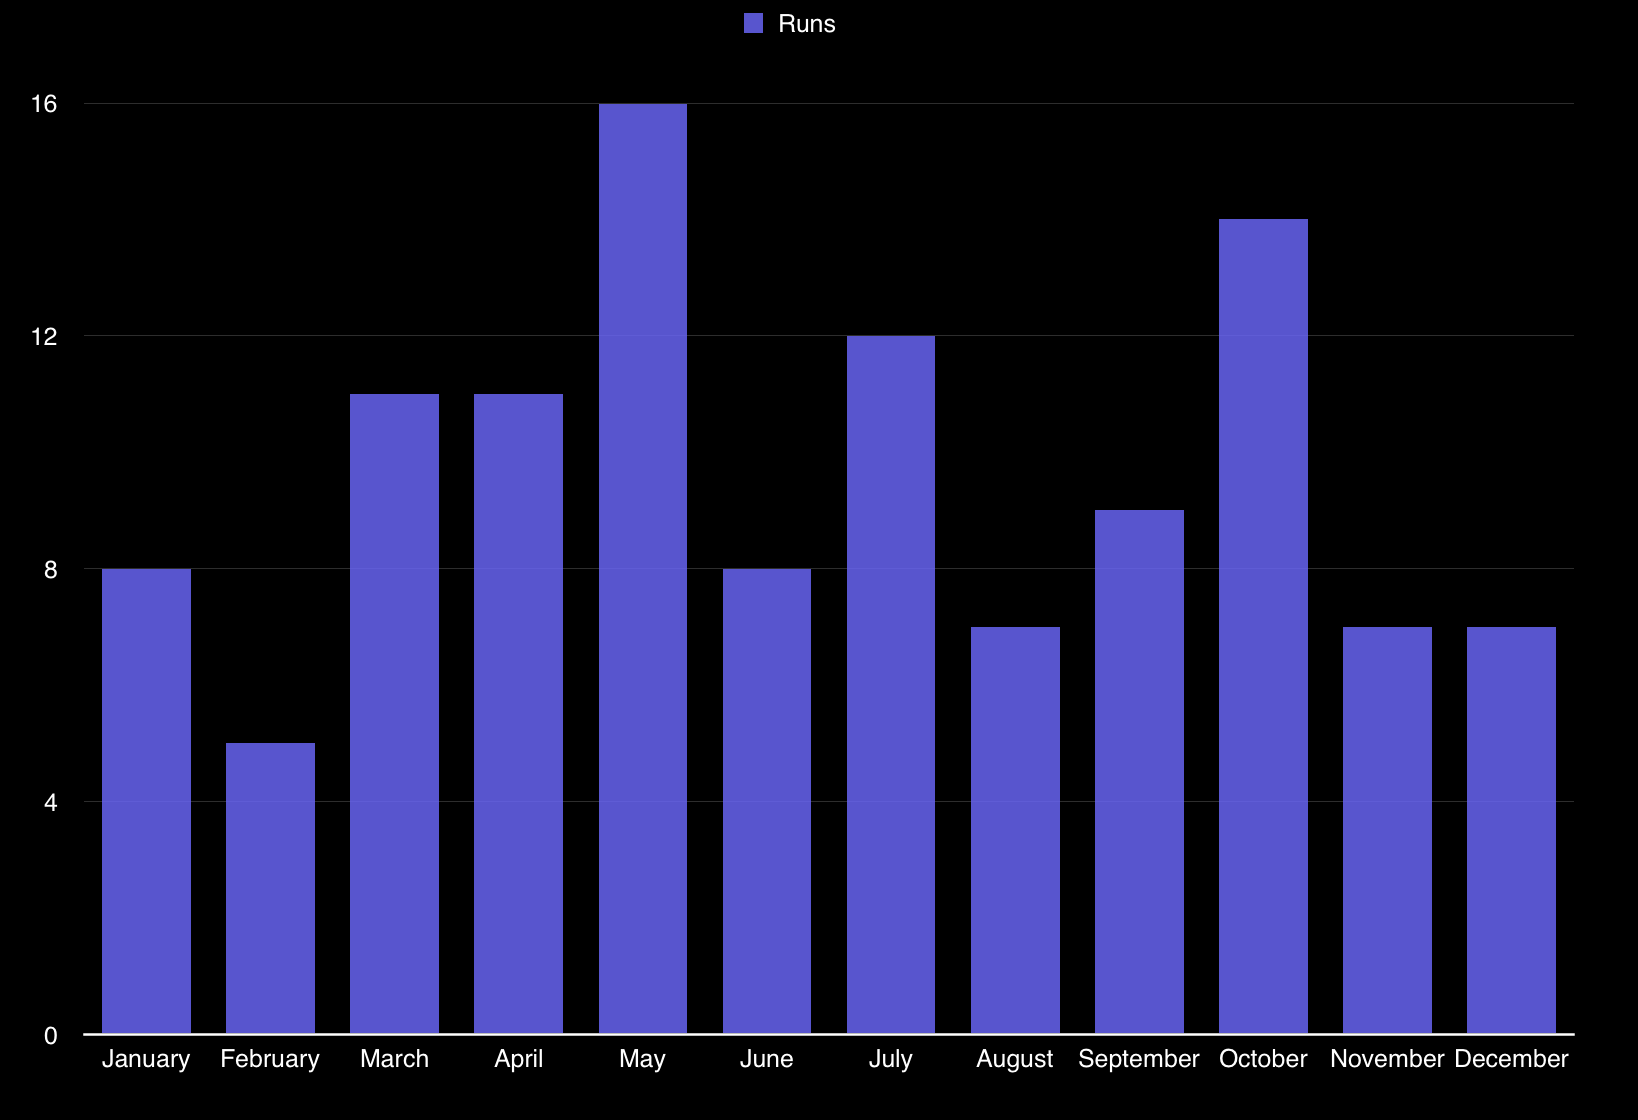
- Total days running: 115
- % of days running: 31%
- Most steps: 36,835 (July 23)
- Best month: May (16 runs)
- Best day of week: Saturday (43 days, 81% of Saturdays)
- Worst day of week: Monday (3 days(!), 6% of Mondays)
- Most in a row: 5 days (Oct 8-12)
- Most day of week in a row: 12 Saturdays (Feb 27-May 14)
- Most without running: 14 (Feb 7-20)
- Total distance ran: 598km (371 miles)
Overall, it was a great year for runs, although I did have some serious lulls throughout the year. Still, I ran about 10% more than last year, so I can't complain.
Weight lifting
Hardware: C9 Champion Hand Weights
As for weight lifting, this is not something I've ever done before. I had no illusions of transforming into a monster this year, but a little extra strength never hurt anyone. I bought a couple 10 lb dumbbells back in January and intended on using them as often as I ran. If I can run 100+ days in a year, why can't I lift weights for a few minutes just as often?
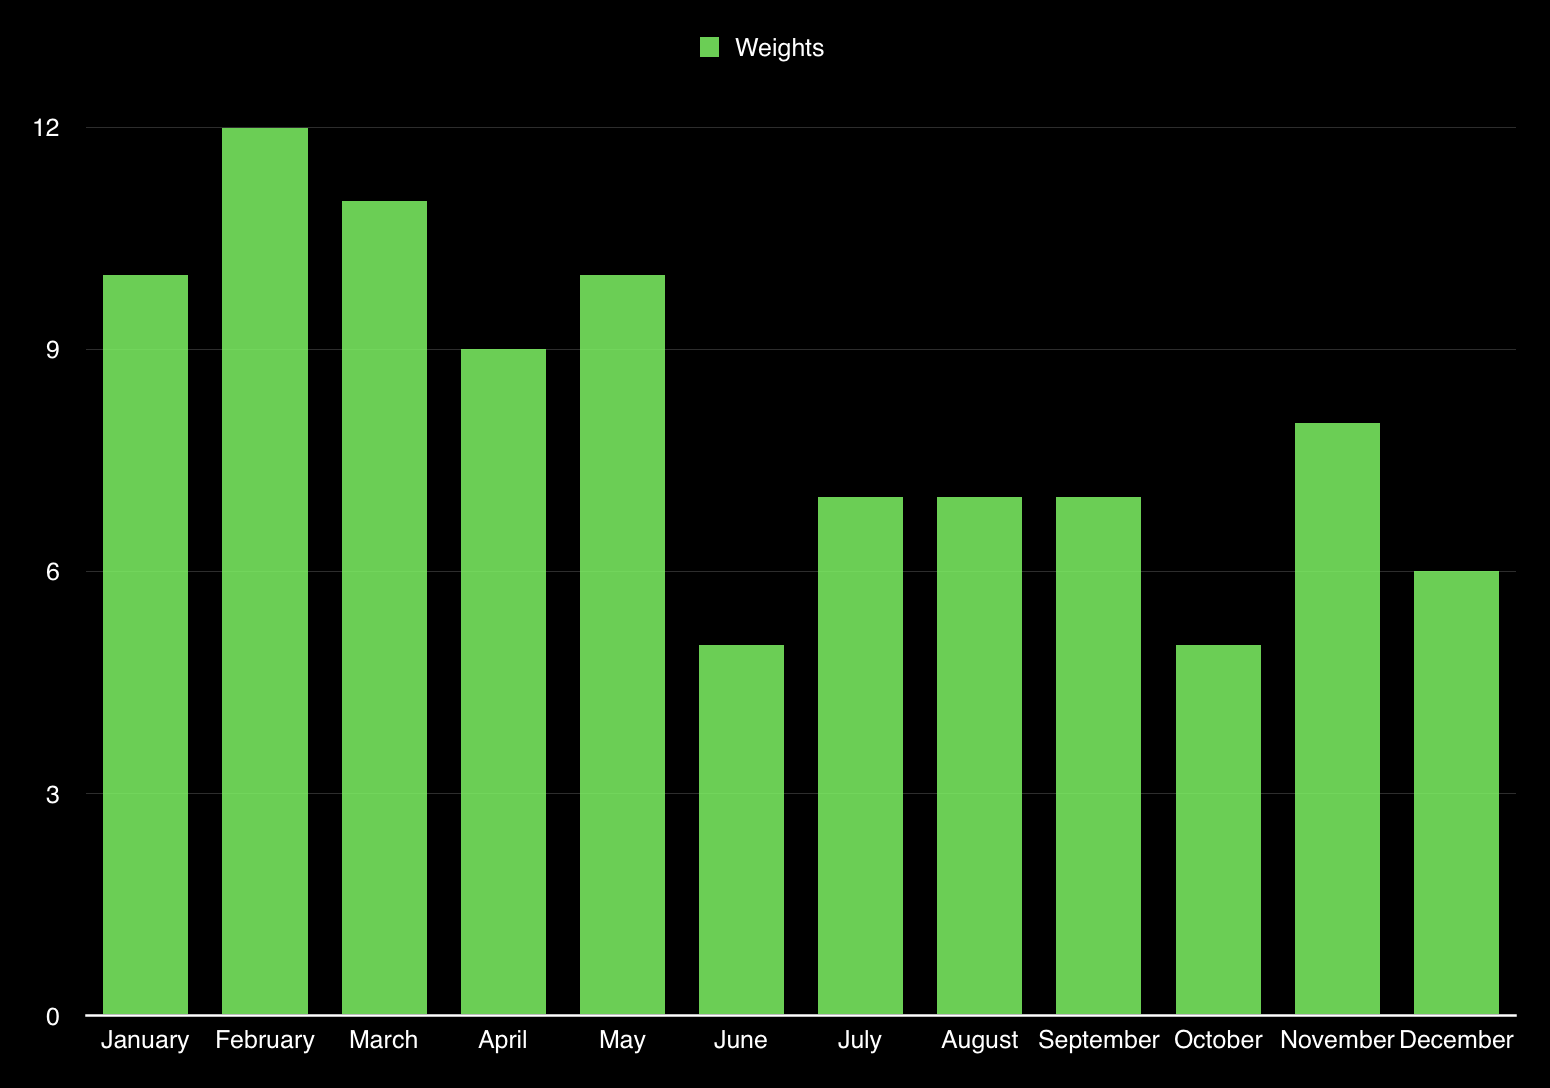
It turns out I couldn't. I absolutely am glad I starting working on my arm strength, but I can definitely do better next year. I worked on arm strength a total of 97 days this year, or 27% of the time. My best month was February, where I lifted 16 times, but I fell off as the summer rolled in, never getting over 8 days in another month.
Finally, I use the Apple Watch to track my overall activity, but I spend so much time on betas and refresh my phone so often that I don't have any large pool of health data to share. It really bugs me how Apple saves Apple Watch data so that people like me can not use it to store data forever. I last restored my phone on July 11, and can say that I have meet my 400 calories goal 109 out of the 161 days since then (68% of the time).
In 2017, my goals are to hold steady on running, and crank up the arm work a ton. I'm hoping for 150 days of weights, and maybe upgrading these 10 pounders for something a little more beefy.
Coffee
Software: Reporter (iOS)
This one is a really boring one, as I drink coffee every day in my morning routine. The number bear this out, as I drank coffee all but 8 days this year. That's 97.8% of the time I had at least one cup of coffee.
Those 8 days where I didn't drink anything were the 2 times I was sick this year. Once was a 4 day stretch in January, and the other was another 4 day stretch in October.
As far as quantity of coffee, I tracked 732 cups of joe, or 2.045 cups for each day I had coffee. That's 45.75 gallons of coffee for those keeping track.
Alcohol
Software: Reporter (iOS)
I guess I'm a walking cliché, but I never drank much beer until the last few years when craft beer started really taking off. Since then I've come to really enjoy a good IPA or wheat beer, and there are no shortage of options out there. Before the numbers, a coupld of my go-to beers are the Goose Island Green Line, Sierra Nevada Beer Camp Tropical IPA, and New Glarus Spotted Cow.
And here's the numbers:
- Days I had any alcohol: 152 (42% of the time)
- Total drinks: 169
- Average drinks per day I drank: 1.11
Nothing too insane here: I'm neither dry nor a drinking fiend. I just like beer.
Sleep
Software: Sleep Cycle (iOS/Android)
I used to get far less sleep than I should at my previous job. I had wonky hours and would have to wake up at 2AM one day and then 10AM the next, only to go back to 5AM the day after that. It's was a bizarre schedule, and one that I was happy to get away from when I changed careers last summer.
Time in bed
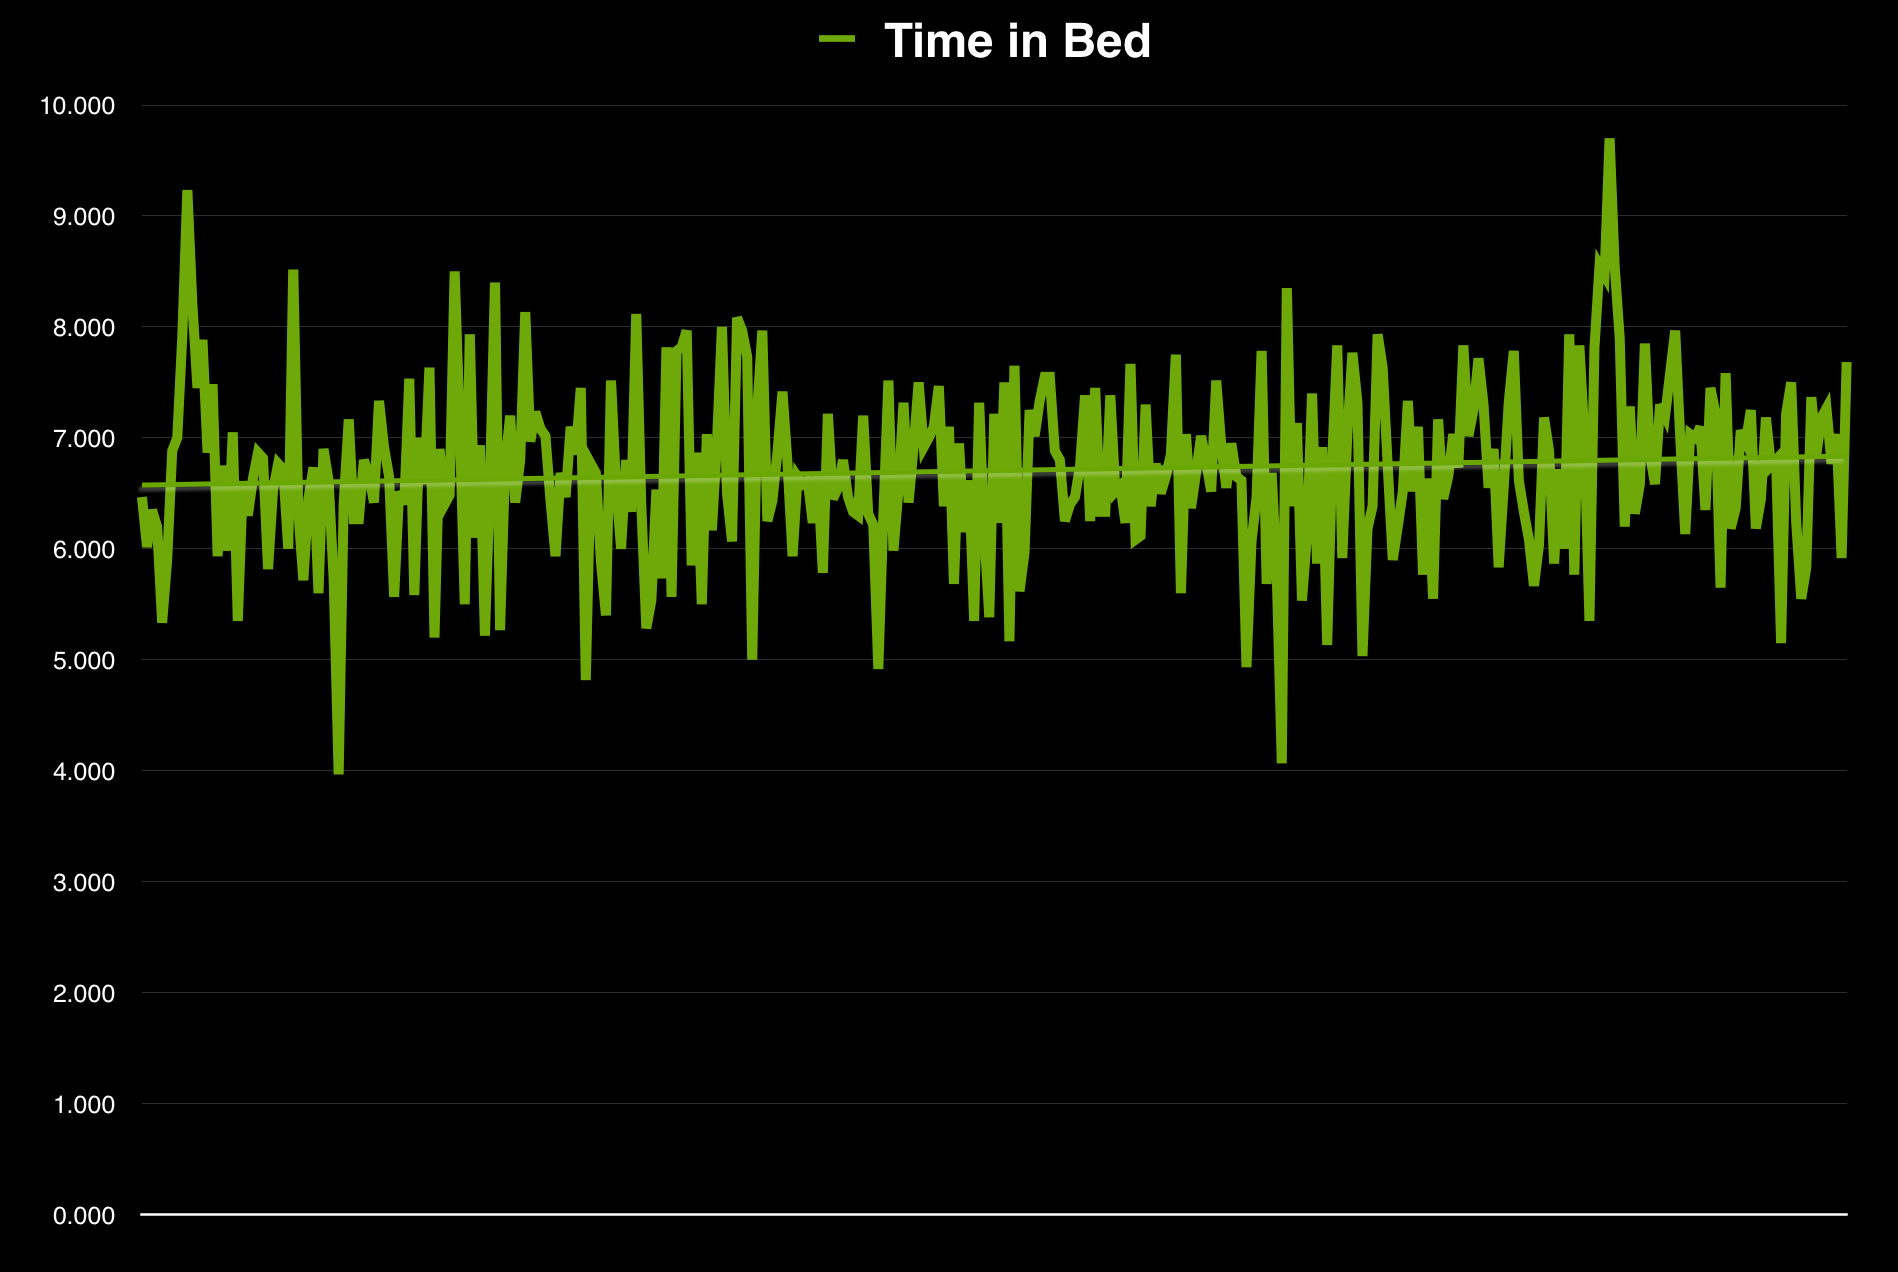
- Average time: 6 hours 42 minutes
- Longest time in bed: 9 hours 42 minutes (October 24)
- Least time in bed: 3 hours 58 minutes (February 11)
Trend: 6.52 hours average at the start of the year, and 6.83 hours at the end. That's an extra 18 minutes of sleep every night, but I could probably afford to get that up over 7 hours next year.
Quality
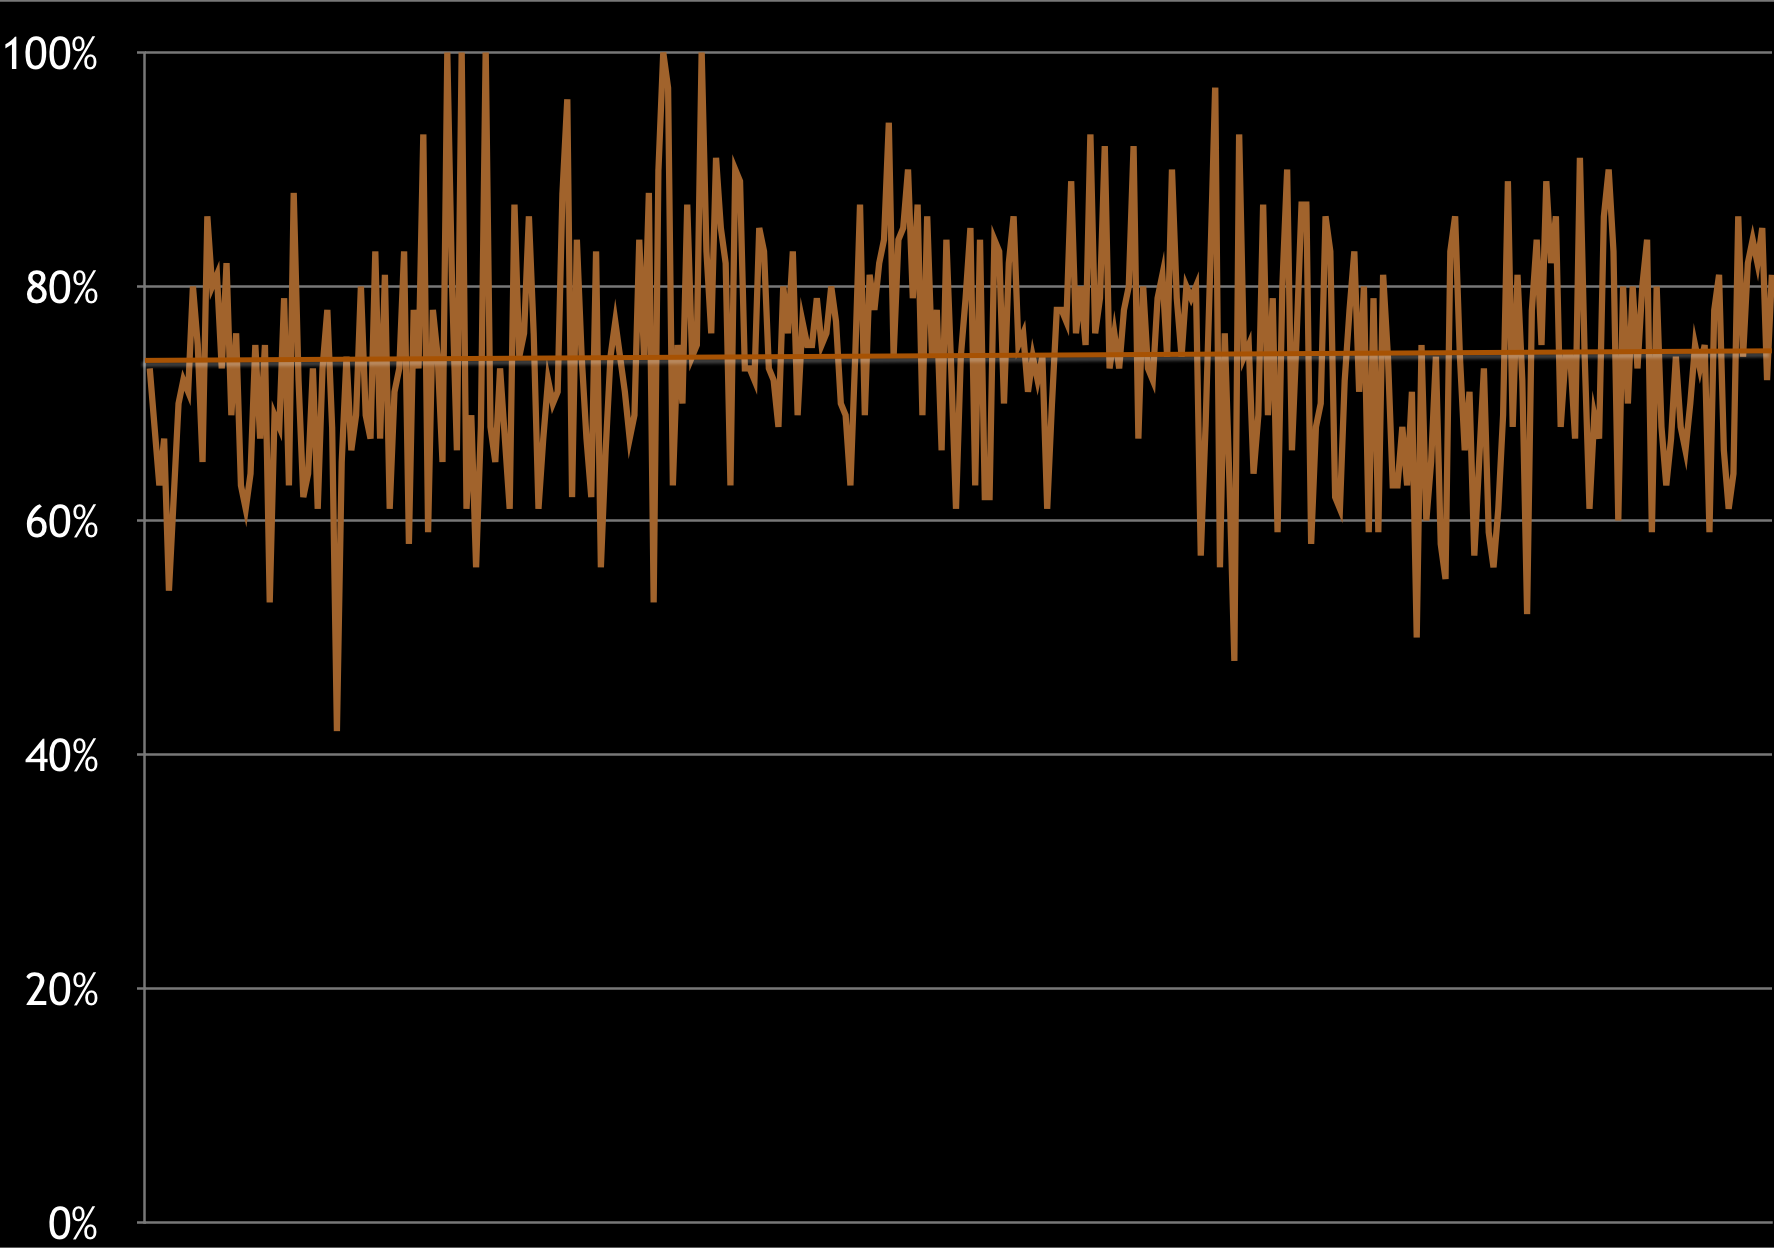
- Average quality: 74%
- Best night: 100% (March 7)
- Worst night: 42% (February 11, again)
Avergages went up minimally, from 73% at the start of the year to 75% at the end. The minor difference is correlated to and almost certainly caused by getting a few more minutes of ZZZs every night.
Wake up time
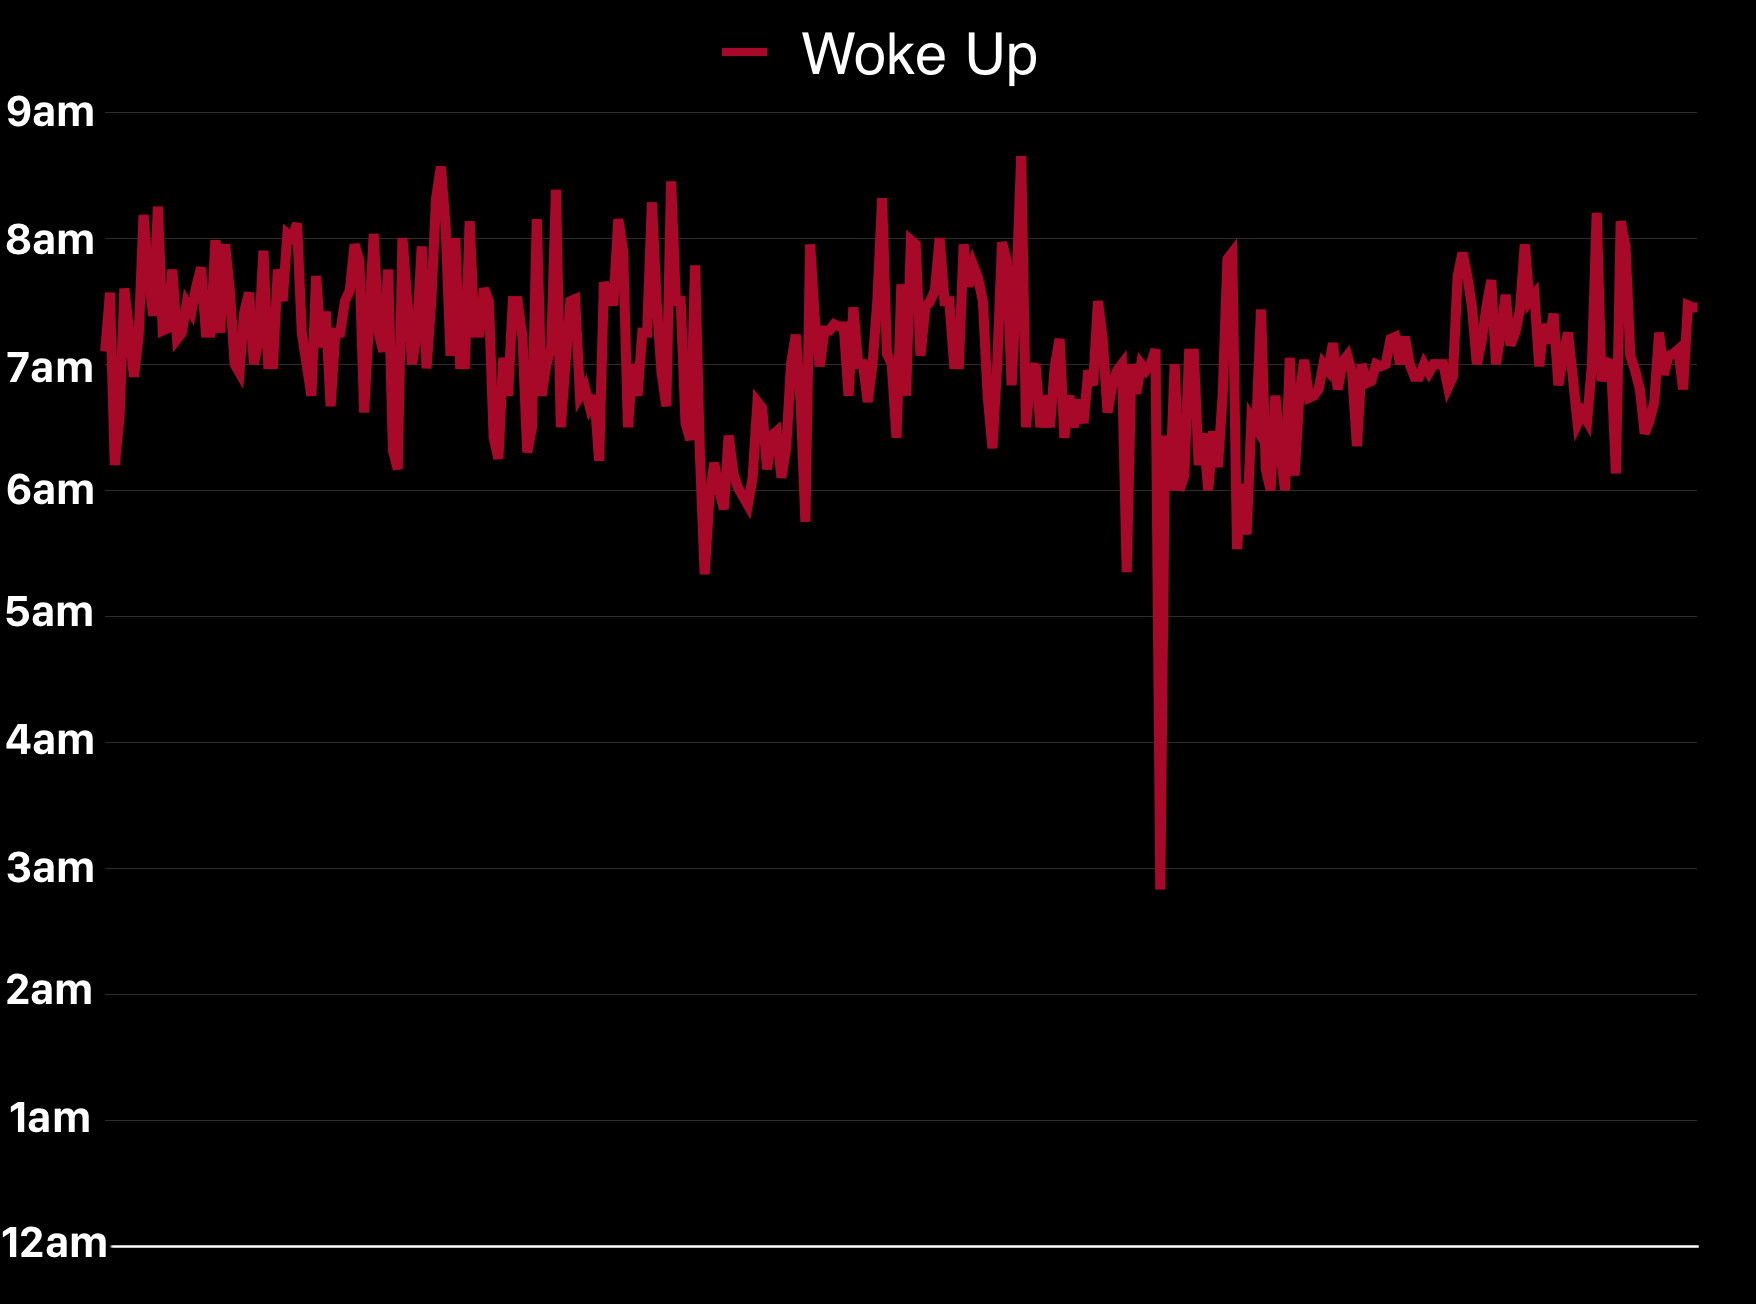
This was a pretty consistent number all year, and if anything I've started waking up earlier (and therefore going to be earlier, if you've been paying attention). Some people might be shocked to see that I never once slept past 9am…ever! My latest day in bed was 8:39. My earliest time was 2:50am for a golf event out of state (7am tee time at a course 3 hours away was an insane idea).
- Average wake up time: 7:04am
Professional
BirchTree
Software: Mint, Google Analytics
2016 was a good year for BirchTree and its sister sites. I'm not about to quit my day job and write full time (although I seriously would if it were viable), but growth was strong. In the interest of full transparency (because why do a quantified life article if you're going to be vague?), the below graph shows traffic totals for BirchTree on the web and in Apple News, as well as some of my side projects like Today Weather and Quick BIN Lookup.
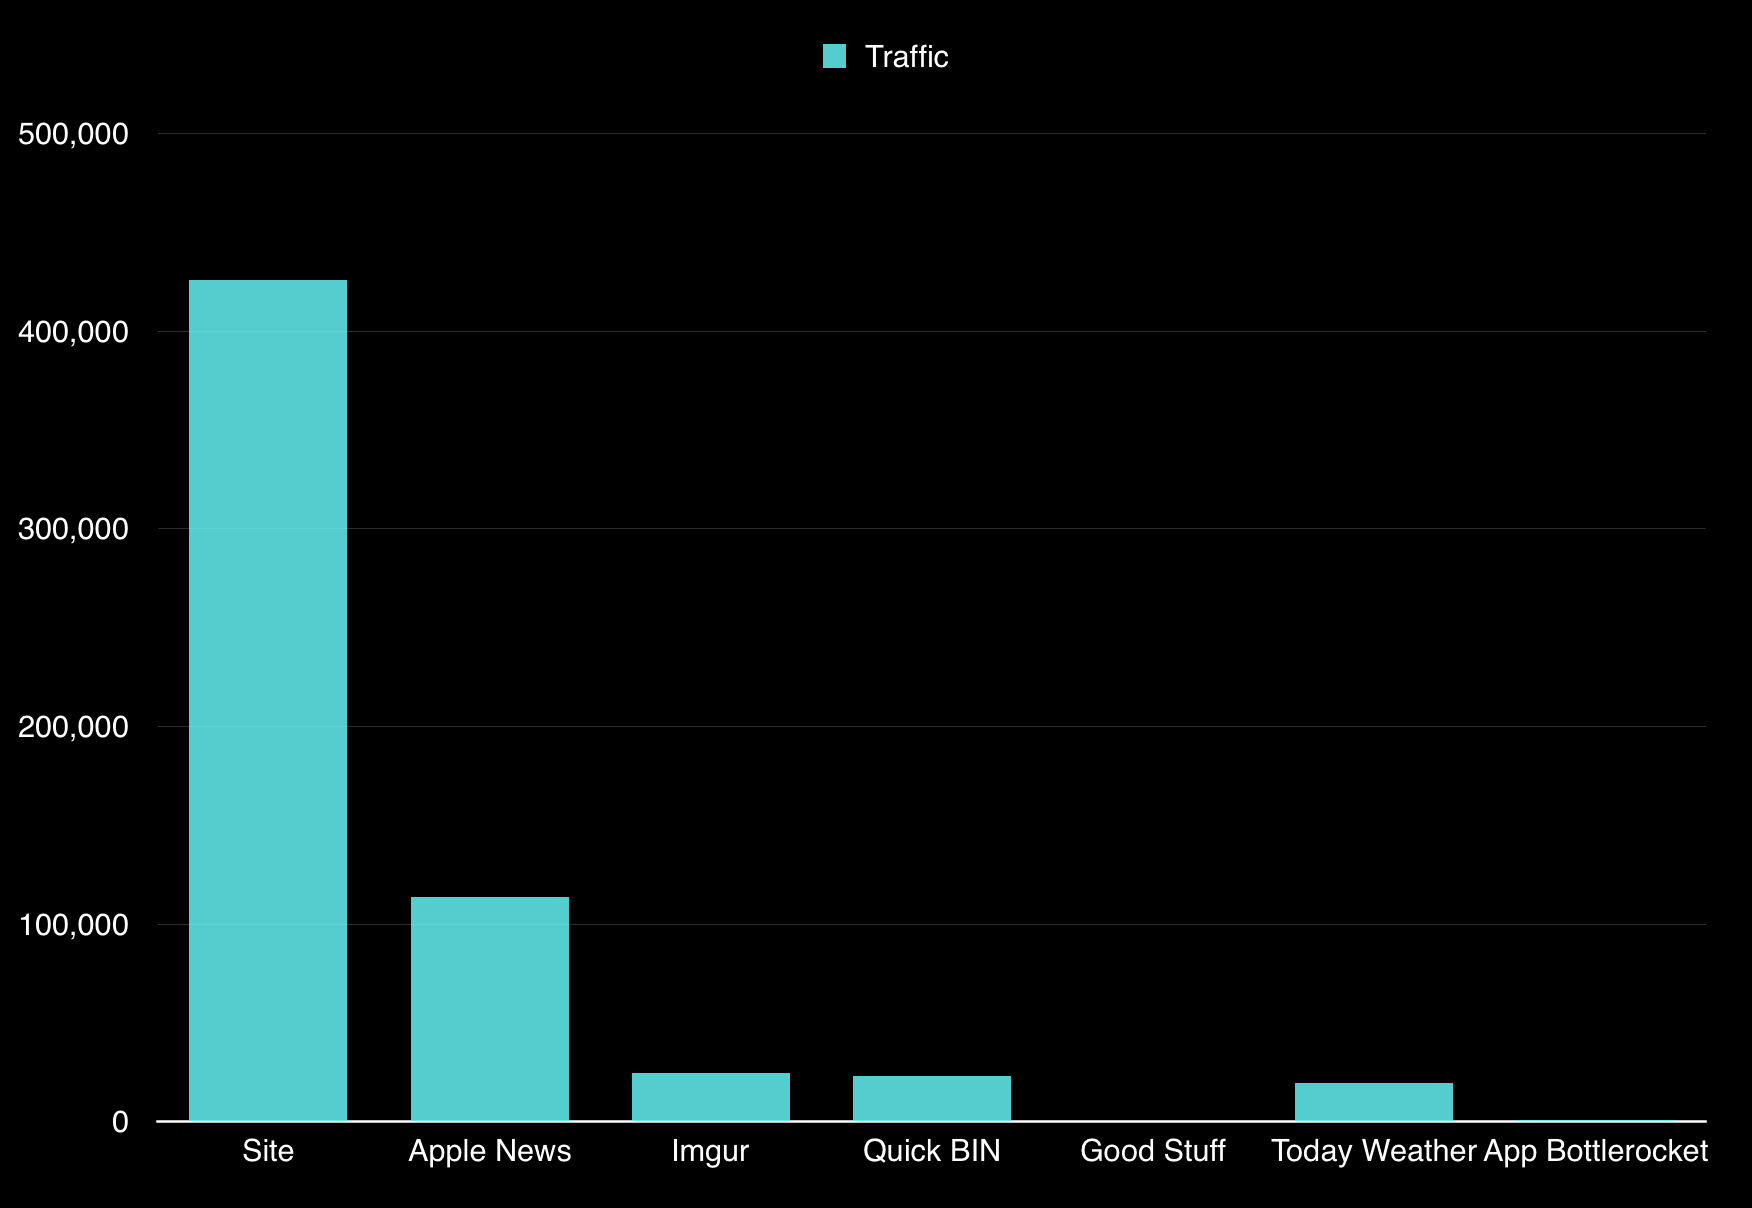
Here's some numbers:
- Growth over 2015: 163% (aka more than doubling last year)
- Biggest month: September (propelled by my watchOS 3 review)
- Most popular post: What If You Used iOS 9’s Low Power Mode all the Time? (77k views)
- Most popular on Apple News: A Love Letter to My Apple Watch (8k views)
- Most popular wallpaper: Retro Mountainscape (25k downloads)
At the end of the day, it's you readers who I have to thank for everything. Thank you for showing up and giving me the motivation to keep at it. I hope you're all enjoying the site 😍
Here's BirchTree's RSS subscribers over the course of the year:
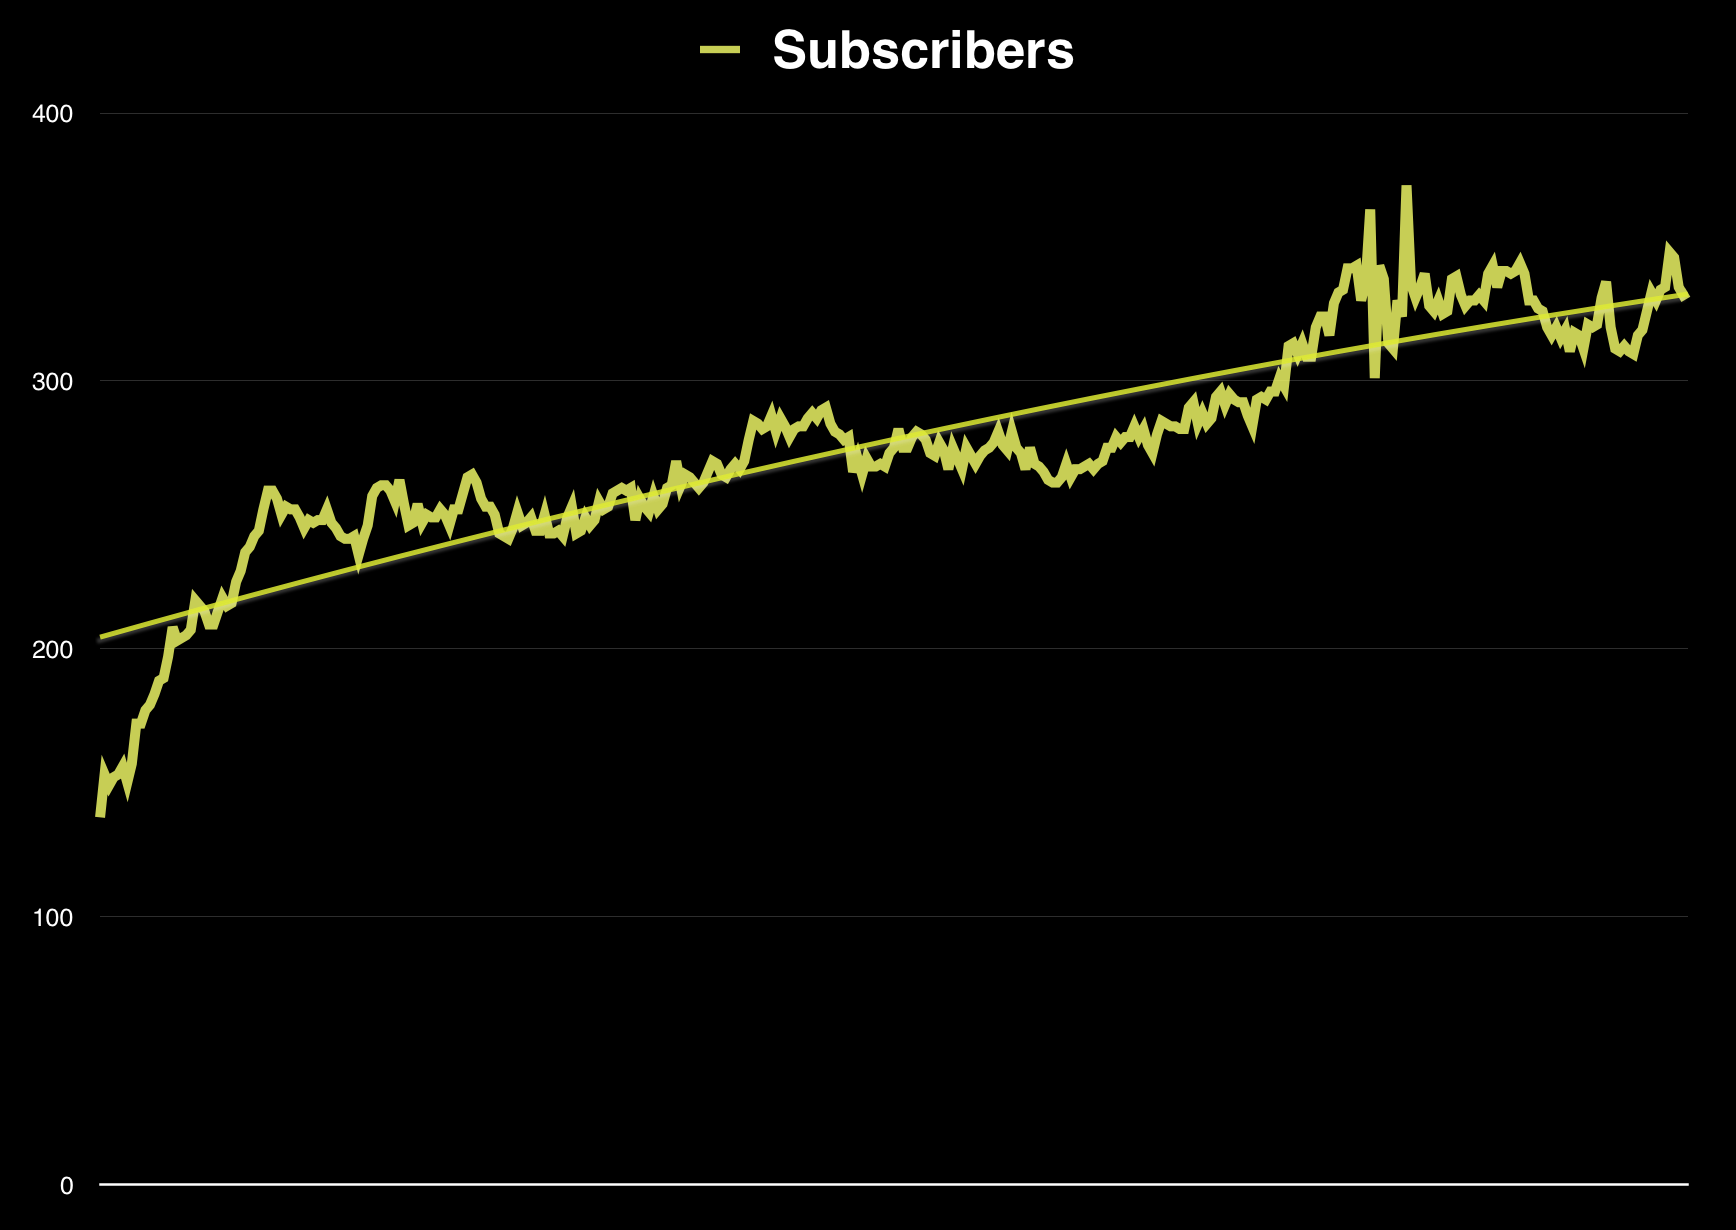
Again, a million thanks!
Twitter has some surprisingly excellent analytics information available to all users. I don't get too deep into them, but Twitter is an important way that I get the word out on my work and need to ensure I'm active there. That sounds a little dirty to me, but I use Twitter because it's fun. I'm lucky enough to have a great group of people I talk to regularly on the service and it's an overwhelmingly positive experience for me. That's definitely not universal, so I'm very thankful for that.
The numbers compared to 2015:
- I tweeted 48% more, with a little more than 9k tweets
- Those tweets received 1.27 million impressions, up 176%
- I was mentioned 7,464 times, up 137%
I know it's not worth much, but me putting 48% more into Twitter resulted in 137% more interactions.
Coding
2016 was also the year I got into development more seriously than ever before. I had long been someone who admired people who developed websites and apps, but was never able to consider myself among their ranks. I aimed to change this in 2016 by focusing more on learning to code in a way that allowed me to fix problems I felt no one had solved yet.
PHP
I didn't know a single $variable type or fucntion() in PHP at the start of the year, and it has been the biggest focus of all my learning this year. PHP may not be the newest, latest, best programming language on the block, but it's incredibly powerful and is a great language to learn as a beginner. The documentation is expansive, and you can Google just about any problem you're having and find someone who has already had that same issue and fixed it.
I used Treehouse, CodeCademy, and a shit ton of Googling to learn what I know now. I'm still absolutely a beginner in this space and I have decades of growth ahead of me, but I'm very proud of how far I've come.
My first project was a simple site that lets people search for a credit card BIN/IIN and see who issued that card. It's a tool that comes up a lot in the payments space in which I work, and there aren't any sites out there that do it like I wanted. Thus birthed Quick BIN Lookup, a simple, fast, and free website that lets you search for a credit card's first six digits and see where it came from. Simple, but useful and my co-workers and I (as well as a decent number of other people, if my analytics are to be believed) use it all the time.
My next project was my biggest, and the one I'm most proud of this year: Today Weather. This site was birthed out of the fundamental truth that there is no weather app perfect for anyone. Everyone has things they wish were different about the weather app or website they use, and I'm not different. I love Dark Sky on my iPhone and CARROT Weather on my Apple Watch, but neither of them is perfect. I built Today Weather to be a perfect weather site for me.
You can read about Today Weather's launch here, but it's my favorite way to get the weather myself, and it's by far my most successful side project to date. It had a great launch, with links from some major tech publications, and despite having to add support for Centigrade ASAP after launch, there are tons of people using the site everyday to check their own weather, and that's just amazing.
The final PHP project of the year was App Bottle Rocket, a site that I thought needed to exist, but apparently no one else did. I launched the site and closed it down within a month of launch. There was no traction, and I decided it wasn't worth paying even Digital Ocean's reasonable $5 per month to keep it active. It still runs at a special URL on Quick BIN Lookup for those who want to use it, but it's proof to me that just because you can make something doesn't mean anyone has to care about it.
HTML, CSS, and JavaScript
I've been working with web design for some time and was already very familiar with much of this world. BirchTree has been running on custom themes for 2 years now, and I like it that way. I like knowing that my site looks good (my opinion, but I really think it looks sharp) and that no one has a site that looks just like it. I didn't throw $100 at the problem and download a theme, the whole thing is my creation.
This year was all about refinement of what I knew in this field. I went deep into flexbox, an awesome new-ish layout format that is really wonderful. All of my products released this year use it to some extent.
It's also been about cleaning up my code. BirchTree runs on about 600 lines of CSS, down from the approximately 1,400 it used a year ago. Even Today Weather, which is a more complicated layout that is totally responsive is a cool 401 lines total. Are there thousands of lines of PHP in there as well? Yes, but let's not dwell on that just now.
Accocrding to my tracking, I wrote code at least a little on 40% of the days on 2016. Not bad, but I'm looking to do more next year.
Personal
This is just the fun stuff, but I wanted to know how many movies I watched, and what my general TV habits are. I get the feeling sometimes that I'm spending my media intake time on fluff that isn't worth as much as it should. I could be watching classic movies, but it's so much easier to watch silly TV shows on Netflix. I didn't go into 2016 with any specific goals, but recording my own trends for media consumption helped me understand how much of the good stuff I was consuming, and how much was just trash.
Movies
Software: Reporter (iOS)
I did not see as many movies in 2016 as I would have liked. In a perfect world I would watch 1-2 movies a week, or 50-100 a year. In reality I came up far short of that, as I simply didn't make the time for them. Some of this time was due to watching TV shows instead, but it was mostly because I chose to do something else. I played video games sometimes, but more often than not I decided to spend my time developing my sites, exercising, or simply writing. Here's a comprehensive list of all movies I've seen in 2016:
- The Witch
- Zootopia
- Batman v Superman: Dawn of Justice
- Captain America: Civil War
- Green Room
- The Nice Guys
- Finding Dory
- Ghostbusters
- The Girl on the Train
- Arrival
- Fantastic Beasts and Where to Find Them
- The Lobster
- Amanda Knox
- The Choice (Frontline)
- Mascots
- Edge of Tomorrow
- Other People
- It Follows
My movie of the year is currently Swiss Army Man. The director has said he hopes the first fart makes you laugh and the last fart makes you cry. That's an absurd statement, but it's not actually that far off. Swiss Army Man is a wonderful film.
Video Games
Software: Reporter (iOS)
Like with movies, I tracked how many new games I played in 2016, and this is the complete list:
- Tharsis
- The Witness
- Firewatch
- Superhot
- Stardew Valley
- Hitman
- Ratchet & Clank
- Axiom Verge (Vita)
- Uncharted 4: A Thief's End
- Doom
- Rise of the Tomb Raider (PS4)
- Titanfall 2
- Dishonored 2
- Batman: The Telltale Series
- Final Fantasy XV
iOS games
- Super Mario Run
- Mini Metro
- Pokémon Go
- Really Bad Chess
As for recommendations, Uncharted 4 is my game of the year, with Firewatch, The Witness, and Doom coming in right behind. It was a pretty good year for games, but I'm hoping 2017 is even stronger.
Watching TV
Software: Reporter (iOS)
I didn't track what TV shows I watched as religiously as my movies or games, instead focusing entirely on quantity. I simply answered yes or no to the question "did I watch over 2 hours of TV today?"
As of a couple years ago, the average American watched 5 hours of TV per night. That seems insane, but it's amazing how fast the time adds up. I think I watched 5 hours a few times, but I watched 2+ hours most days. By my numbers, I watched at least 2 hours of TV 65% of the time. It works out to very close to 2/3 of the time, which sounds like a lot to me, but I guess it's not that bad when compared to the national average.
Despite being better then most Americans, I want to get this number down in 2017. I like TV, so I don't want to cut it out entirely, but dropping it down below 50% would be great.
Conclusion
Ultimately what's important is not what these numbers say, but what I'm going to do now that I know them. Without being too full of myself, I think I'm doing pretty well overall. I improved my health this year, lowering my weight, increasing muscle mass, and increasing the number of workouts I did over last year. My professional life (outside of my day job) is progressing at a good clip as well, with engagement at an all time high and still rising. Finally,I play enough games, watch less TV than most people, and would like to watch more movies next year.
What this tells me is that I can let a lot of this tracking go in 2017, or at least ease off on how detailed I track everything. Maybe I'll take stock every couple weeks instead of every single day. Maybe I don't need to track my coffee intake since there's basically nothing to gleam from that information.
I think 2017 will be more focused on tracking personal finances and professional development, both day job and side hustle. Don't expect such an in-depth dive next year though, since I don't think I'll be as keen to share my actual finances with the world!
Have a wonderful new year, and I hope you set some goals for the new year and stick to them.